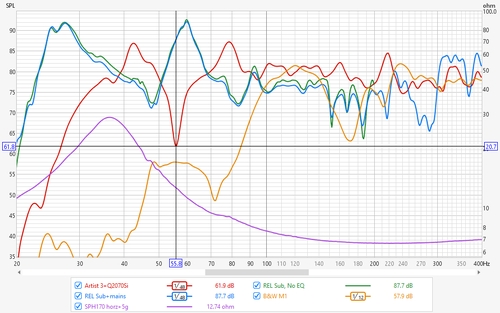
The All SPL graph is an overlay graph that shows all measurements (SPL and/or Impedance) that have been made. It allows an average to be generated of all selected traces, arithmetic operations to be carried out on pairs of traces to generate a new trace, pairs of traces to be aligned and Inter-Aural Cross Correlation to be calculated for a pair of traces.
Right clicking on the graph brings up a menu of actions which are applied to all measurements selected in the graph legend:
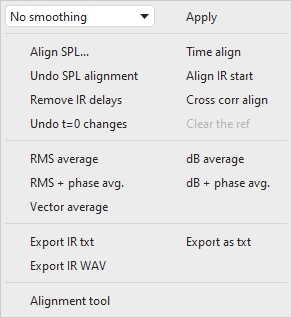
The remaining action is:
Right clicking on the selector brings up additional actions that depend on the current graph, for the All SPL graph there are controls to adjust the SPL offset and to set a measurement as a reference for other measurements.
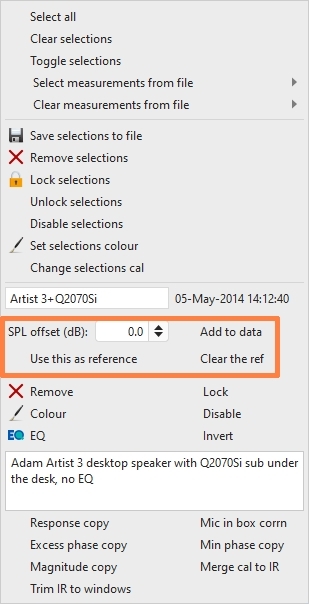
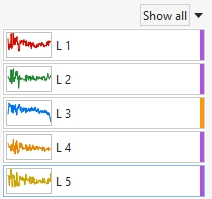
If a measurement is set as a reference it has an orange band on the selection list, measurements using another as a reference have a purple band. Those measurements using the reference change their SPL plots to show the difference between them and the reference.
Trace Arithmetic help is here.
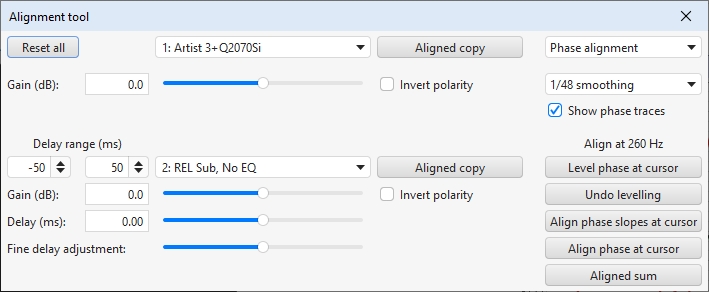
The Alignment tool allows gain, polarity and delay adjustments to be made to a pair of measurements with a live preview of the summed result updated as the parameters are changed (the preview uses log spaced data at 96 PPO so may differ slightly from the final result). There is also a dotted trace which shows the result of a summation of the measurements ignoring phase. When the alignment tool is opened the All SPL graph selections change to show only the traces being aligned. Other traces may be selected in the graph legend if desired. The original trace selections are restored when the alignment tool is closed. There are two sliders for delay adjustment of the B measurement, one for coarse adjustment and one for fine to provide a wide manual adjustment range. The delay range the alignment tool will use when trying to align measurements is set by the Delay range (ms) controls. The tool can operate in phase or impulse alignment modes.
The Aligned copy buttons generate a copy of the selected measurement with the alignment gain, delay and polarity selections applied. Aligned sum generates a new measurement with the summed results of the alignment settings.
When Show phase traces is selected in phase alignment mode the All SPL graph is split with the SPL traces at the top and phase traces for the two selected measurements at the bottom. When Show summed phase is selected the phase of the aligned sum is also shown. If Remove time delay is selected the impulse responses are shifted so that the first measurement IR starts at t=0, that can reduce wraps in the phase traces.
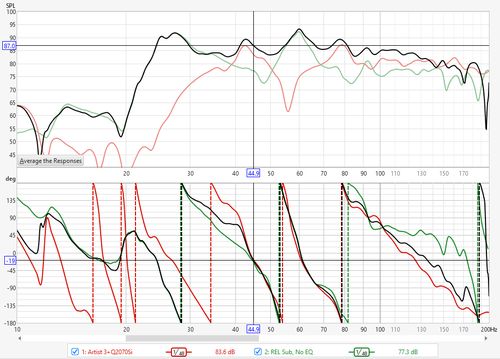
The Level phase at cursor button calculates the delay required to bring the first measurement phase trace to be approximately horizontal around the frequency of the cursor in the phase trace graph. Both measurements have the same delay applied so the relative delays required to align them are not affected. Shifting the phase traces in that way makes it easier to align them. The delay is only used to update the phase traces, it is not applied when using Aligned copy or Aligned sum. Undo levelling removes the levelling delay from both measurements.
The Align phase slopes at cursor button calculates the measurement 2 delay required to give both phase traces approximately the same slope around the frequency of the cursor in the phase trace graph, so they have approximately the same group delay. Note that the phase traces may still be far apart, particularly if one measurement is out of phase with the other. In that case inverting one of the measurements would bring the phase traces closer together.
The Align phase at cursor button calculates the measurement 2 delay required to bring both phase traces as close as possible to each other around the frequency of the cursor in the phase trace graph. Note that a better overall alignment might be achieved by inverting one of the measurements and then aligning phase, and/or by manually adjusting the delay.
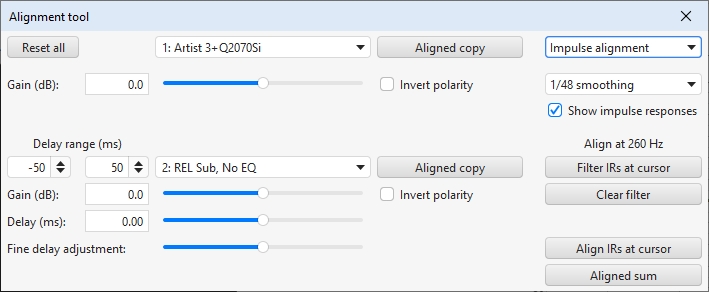
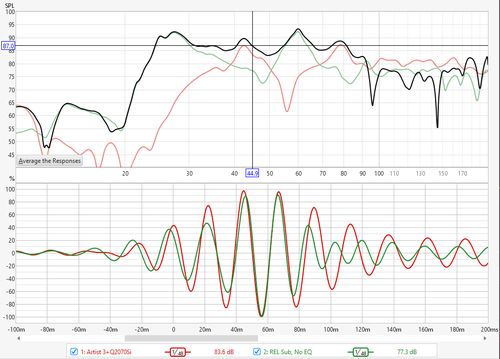
When Show impulse responses is selected in impulse alignment mode the All SPL graph is split with the SPL traces at the top and impulse responses for the two selected measurements at the bottom. To perform impulse alignment the responses are filtered at the cursor frequency with a 1/3 octave zero phase filter, the filtered responses are then aligned. The time span of the filtered impulse response graph adjusts to suit the alignment frequency.
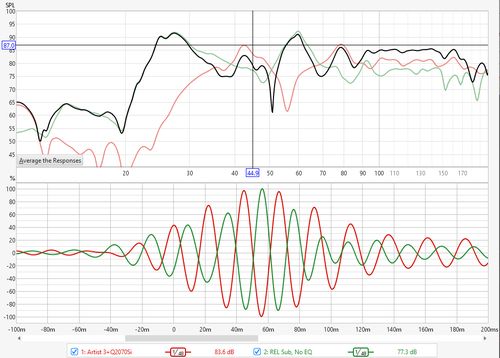
The Align IRs at cursor button applies the filters at the cursor frequency and cross-correlates the responses to determine their best alignment. The alignment result may require inversion of one of the responses, which is evident in the impulse response display above. Here is the response after inverting the polarity of the subwoofer trace.
That ability to ignore polarity in finding the best alignment of the responses is an advantage of the impulse alignment mode, but it may struggle to align the filtered responses in an environment with strong modal resonances near the chosen alignment frequency as the resonance may dominate the filtered response.
The control panel for the All SPL graph has these controls:
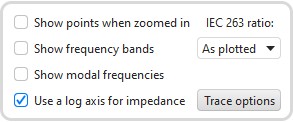
If Show points when zoomed in is selected the individual points that make up the SPL and phase responses are shown on the graph when the zoom level is high enough for them to be distinguished (which may only be over part of the plot)
If Show frequency bands is selected the audio frequency bands are shown in a stripe above the graph. The bands are:
If Show modal frequencies is selected the theoretical modal frequencies for the room dimensions entered in the Modal Analysis section of the EQ Window for the currently selected measurement are plotted at the bottom of the graph.
When impedance is being plotted the axis has a span from 0 to 1 kohm. If a larger impedance range is required the axis can be switched to logarithmic with a range up to 1 Mohm using the Use a log axis for impedance check box. If selected a log axis will be used wherever impedance is plotted.
The IEC 263 ratio control allows the graph to be locked to a specified dB/decade aspect ratio. The aspect ratio is maintained by adjusting the margins around the graph as required.
The Trace options button brings up a dialog that allows the line type of the graph traces to be changed.